
")


")

")
")
Investor Relations
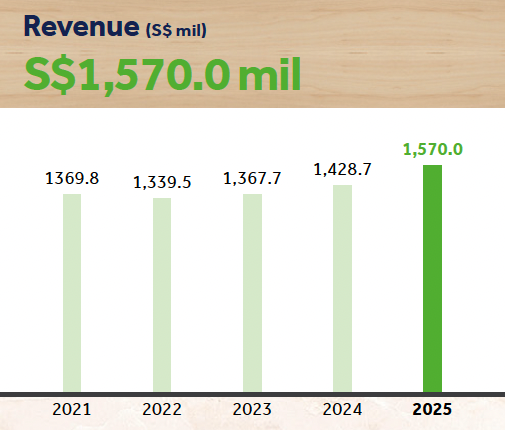
Established in 1985 and listed on the Mainboard of the Singapore Exchange (SGX) in 2011, we are
one of
Singapore’s top retailers with over S$1.5 billion in annual sales revenue (FY2025). As of 2026, we operate in
more than
88 locations across Singapore. With a current market capitalisation exceeding S$4.0 billion, Sheng Siong Group
Ltd is one
of the largest listed companies on the SGX.
At Sheng Siong, we strive to create value for our shareholders sustainably. In this section you
will find
all you need to know about our performance as a business.
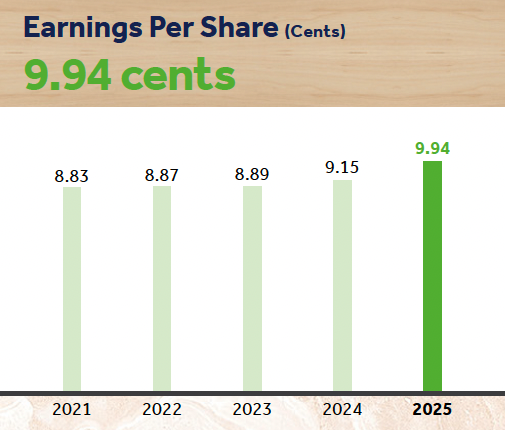
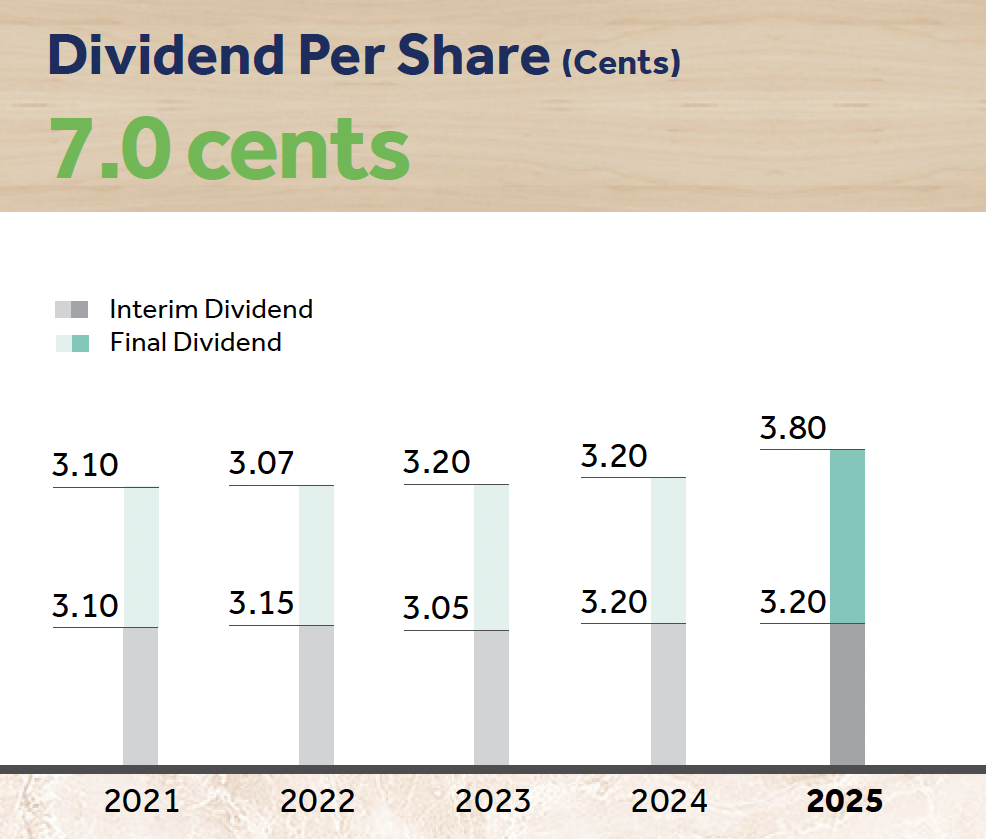
Financial Highlights
Financial Reports / AGM Matters
► 2026 Financials
2026
AGM Minutes
(PDF – 69 KB)
SSG AGM Notice
(PDF – 6.4 MB)
SSG Proxy Form
(PDF – 262 KB)
SSG
Responses to AGM Questions
(PDF – 153 KB)
Q2
2026 Financial Statement
(PDF – 427 KB)
Q1 2026 Business Update
(PDF – 290 KB)
► 2025 Financials
FY 2025
Sustainability Report
(PDF – 11.6 MB)
2025
AGM Minutes
(PDF – 75 KB)
SSG
Responses to AGM Questions
(PDF – 173 KB)
SSG
AGM Notice
(PDF – 2.3 MB)
SSG Proxy Form
(PDF – 85.6 KB)
FY 2025
Annual Report
(PDF – 14.8 MB)
Q4
2025 Financial Statement
(PDF – 628 KB)
Q3
2025 Business Update
(PDF – 331 KB)
Q2
2025 Financial Statement
(PDF – 239 KB)
Q1
2025 Business Update
(PDF – 123 KB)
► 2024 Financials
FY 2024
Sustainability Report
(PDF – 7.7 MB)
2024 AGM Minutes
(PDF – 130KB)
SSG Responses to AGM Questions
(PDF – 110 KB)
SSG
AGM Notice
(PDF – 6.6 MB)
SSG
Proxy Form
(PDF – 85.1 KB)
FY 2024
Annual Report
(PDF – 9.5 MB)
Q4
2024 Financial Statement
(PDF – 773 KB)
Q3
2024 Business Update
(PDF – 491 KB)
Q2
2024 Financial Statement
(PDF – 421 KB)
Q1
2024 Business Update
(PDF – 256 KB)
► 2023 Financials
FY 2023
Sustainability Report
(PDF – 14.5 MB)
2023
AGM Minutes
(PDF – 168 KB)
SSG Letter to Shareholder
(PDF – 138 KB)
SSG AGM Notice
(PDF – 2 MB)
SSG Proxy Form
(PDF – 77 KB)
SSG Responses to AGM Questions
(PDF – 373 KB)
FY 2023
Annual Report
(PDF – 7.6 MB)
Q4 2023 Financial Statement
(PDF – 549 KB)
Q3 2023 Business Update
(PDF – 296 KB)
Q2 2023 Financial Statement
(PDF – 443 KB)
Q1 2023 Business Update
(PDF – 461 KB)
► 2022 Financials
FY 2022
Sustainability Report
(PDF – 4 MB)
2022
AGM Minutes
(PDF – 166 KB)
SSG Responses to AGM Questions
(PDF – 127 KB)
SSG Letter to Shareholder
(PDF – 109 KB)
SSG AGM Notice
(PDF – 6 MB)
SSG Proxy Form
(PDF – 77 KB)
FY 2022
Annual Report
(PDF – 7 MB)
Q4 2022 Financial Statement
(PDF – 576 KB)
Q3 2022 Business Update
(PDF – 282 KB)
Q2 2022 Financial Statement
(PDF – 479 KB)
Q1 2022 Business Update
(PDF – 234 KB)
► 2021 Financials
FY 2021
Sustainability Report
(PDF – 14 MB)
2021
AGM Minutes
(PDF – 156 KB)
SSG Responses to AGM Questions
(PDF – 85 KB)
SSG Letter to Shareholder
(PDF – 143 KB)
SSG AGM Notice
(PDF – 36 KB)
SSG Proxy Form
(PDF – 150 KB)
FY 2021
Annual Report
(PDF – 6 MB)
Q4 2021 Financial Statement
(PDF – 625 KB)
Q3 2021 Business Update
(PDF – 257 KB)
Q2 2021 Financial Statement
(PDF – 519 KB)
Q1 2021 Business Update
(PDF – 263 KB)
► 2020 Financials
FY 2020
Sustainability Report
(PDF – 3.5 MB)
2020
AGM Minutes
(PDF – 205 KB)
2020
AGM Results
(PDF – 205 KB)
SSG
Responses to AGM Questions
(PDF – 180 KB)
SSG
Corrigendum to AR
(PDF – 230 KB)
SSG
Letter to Shareholder
(PDF – 98 KB)
SSG
AGM Notice
(PDF – 138 KB)
SSG
Proxy Form
(PDF – 92 KB)
FY 2020
Annual Report
(PDF – 7 MB)
Q4 2020 Financial Statement
(PDF – 487 KB)
Q3 2020 Business Update
(PDF – 344 KB)
Q2 2020 Financial Statement
(PDF – 391 KB)
Q1 2020 Business Update
(PDF – 264 KB)
► 2019 Financials
FY 2019
Sustainability Report
(PDF – 5 MB)
2019
AGM Minutes
(PDF – 189 KB)
FY 2019
Annual Report
(PDF – 8 MB)
Q4 2019 Financial Statement
(PDF – 459 KB)
Q3 2019 Financial Statement
(PDF – 415 KB)
Q2 2019 Financial Statement
(PDF – 401 KB)
Q1 2019 Financial Statement
(PDF – 348 KB)
► 2018 Financials
FY 2018
Sustainability Report
(PDF – 5 MB)
FY 2018
Annual Report
(PDF – 7 MB)
Q4 2018 Financial Statement
(PDF – 446 KB)
Q3 2018 Financial Statement
(PDF – 414 KB)
Q2 2018 Financial Statement
(PDF – 383 KB)
Q1 2018 Financial Statement
(PDF – 337 KB)
► 2017 Financials
FY 2017
Sustainability Report
(PDF – 6.73 MB)
FY 2017
Annual Report
(PDF – 5.36 MB)
Q4 2017 Financial Statement
(PDF – 483 KB)
Q3 2017 Financial Statement
(PDF – 413 KB)
Q2 2017 Financial Statement
(PDF – 393 KB)
Q1 2017 Financial Statement
(PDF – 337 KB)
► See More
► 2016
Financials
FY 2016
Annual Report
(PDF – 20.6 MB)
Q4 2016 Financial Statement
(PDF – 474 KB)
Q3 2016 Financial Statement
(PDF – 411 KB)
Q2 2016 Financial Statement
(PDF – 457 KB)
Q1 2016 Financial Statement
(PDF – 429 KB)
► 2015
Financials
FY 2015
Annual Report
(PDF – 6.72 MB)
Q4 2015 Financial Statement
(PDF – 519 KB)
Q3 2015 Financial Statement
(PDF – 486 KB)
Q2 2015 Financial Statement
(PDF – 483 KB)
Q1 2015 Financial Statement
(PDF – 421 KB)
► 2014
Financials
FY 2014
Annual Report
(PDF – 2.37 MB)
Q4 2014 Financial Statement
(PDF – 5.92 MB)
Q3 2014 Financial Statement
(PDF – 361KB)
Q2 2014 Financial Statement
(PDF – 367 KB)
Q1 2014 Financial Statement
(PDF – 311 KB)
► 2013
Financials
FY 2013
Annual Report
(PDF – 2.36 MB)
Q4 2013 Financial Statement
(PDF – 285 KB)
Q3 2013 Financial Statement
(PDF – 361 KB)
Q2 2013 Financial Statement
(PDF – 309 KB)
Q1 2013 Financial Statement
(PDF – 372 KB)
► 2012
Financials
FY 2012
Annual Report
(PDF – 1.52 MB)
Q4 2012 Financial Statement
(PDF – 341 KB)
Q3 2012 Financial Statement
(PDF – 383 KB)
Q2 2012 Financial Statement
(PDF – 360 KB)
Q1 2012 Financial Statement
(PDF – 131 KB)
► 2011
Financials
FY 2011
Annual Report
(PDF – 1.72 MB)
Q4 2011 Financial Statement
(PDF – 156 KB)
Q3 2011 Financial Statement
(PDF – 164 KB)
►
Initial Public Offering (IPO)
User Tools & External Links / Resources
Tool: Investment Calculator
Note: User to check the respective information such as rates, commission, taxes,
etc before
using the above tool.
External Links / Resources
Stock Quotes
►
Bloomberg
(SSG.SI)
►
Google Finance (OV8.SI)
►
Reuters
(SHEN.SI)
►
Yahoo!®
Singapore
Finance (OV8.SI)
Disclaimer: The data from the external links are for informational purposes
only, not
intended for trading purposes or advice. Sheng Siong Group Ltd will not be liable for any informational
errors,
incompleteness, or delays, or for any actions taken in reliance on information provided by the external
links.
INVESTOR TOOL